



The GHRmodel package supports modeling health outcomes using Bayesian hierarchical spatio-temporal models with complex covariate effects (e.g., linear, non-linear, interactions, distributed lag linear and non-linear models) in the R-INLA framework. It is designed to help users identify key drivers and predictors of disease risk by enabling streamlined model exploration, comparison, and visualization of complex covariate effects.
The image below shows the structure of the GHRmodel package, outlining its functions (in blue), GHRmodel-specific output objects (in purple), generic output objects (in grey), and general functionality. Generic output objects can be provided directly by the user or can be generated using GHRmodel helper functions.

The GHRmodel package is designed to work in tandem with other packages of the GHRtools suite: GHRexplore, which facilitates data exploration and visualization, and GHRpredict, which computes out-of-sample probabilistic predictions of models developed in GHRmodel and enables predictive performance evaluation.
More information about the toolkit, with tutorials and published examples can be found at this website.
The latest version of the GHRmodel package is hosted on CRAN and can by installed using the following commands:
# Install from CRAN
install.packages("GHRmodel")

# Get the development version from Gitlab
library(devtools)
devtools::install_git('https://earth.bsc.es/gitlab/ghr/ghrmodel.git')
GHRmodel depends on the INLA package, which is not available on CRAN. Instead, it must be installed from its own repository as follows:
 install.packages("INLA",repos=c(getOption("repos"),
                  INLA="https://inla.r-inla-download.org/R/stable"), dep=TRUE)
In case you run into any issues, please check the installation instructions on the R-INLA website.
Several vignettes are available to explore GHRmodel.
Vignettes loaded in the package can be accessed in R by typing
vignette("vignettename") (e.g.,
vignette("GHRmodel_overview")).
The vignettes are: - "GHRmodel_overview": a general
introduction to the main functionalities of the package, including a
worked example. - "GHRmodel_covariates": shows how to
create INLA-compatible formulas for complex Bayesian spatio-temporal
models (including interactions, varying and replicated effects). -
"GHRmodel_DLNM": demonstrates how Distributed Lag Nonlinear
Models (DLNMs) are integrated into the GHRmodel
spatio-temporal Bayesian hierarchical modelling framework to estimate
the delayed and nonlinear effects of various exposures on disease
risk.
To fit a model with R-INLA, formulas need to follow its required syntax and structural conventions. INLA-compatible model formulas can be developed using either:
User-defined INLA-compatible input, which may consist of either user-defined covariate lists or user-defined formula lists.
GHRmodel helper functions that allow the user to pre-process and transform covariates and streamline writing INLA-compatible formulas.
In this example the user provides a list of INLA-compatible model
formulas. These are passed to the as_GHRformulas() function
to be converted into a standardized GHRformulas object.
This ensures consistent output structure and random effect specification
across models that can be interpreted by the function
fit_models() for model fitting.
library("GHRmodel")

# Load example dataset
data(dengue_MS)
dengue_MS <- dengue_MS[dengue_MS$year %in% 2010:2012, ]

# Declare formulas
formulas <- c(
  "dengue_cases ~ tmin +  f(year, model='rw1')",
  "dengue_cases ~ pdsi +  f(year, model='rw1')"
)
The fit_models() function allows users to fit a set of
INLA-compatible model formulas defined by a GHRformulas
object to a provided data set. It automates model fitting, extraction of
outputs, and computation of a wide range of goodness-of-fit (GoF)
metrics. The output is a GHRmodels object.
# Fit multiple models
results <- fit_models(
  formulas = formulas,
  data = dengue_MS,
  family = "nbinomial",
  offset_var = "pop100000",
  nthreads = 2,
  progress = TRUE
)
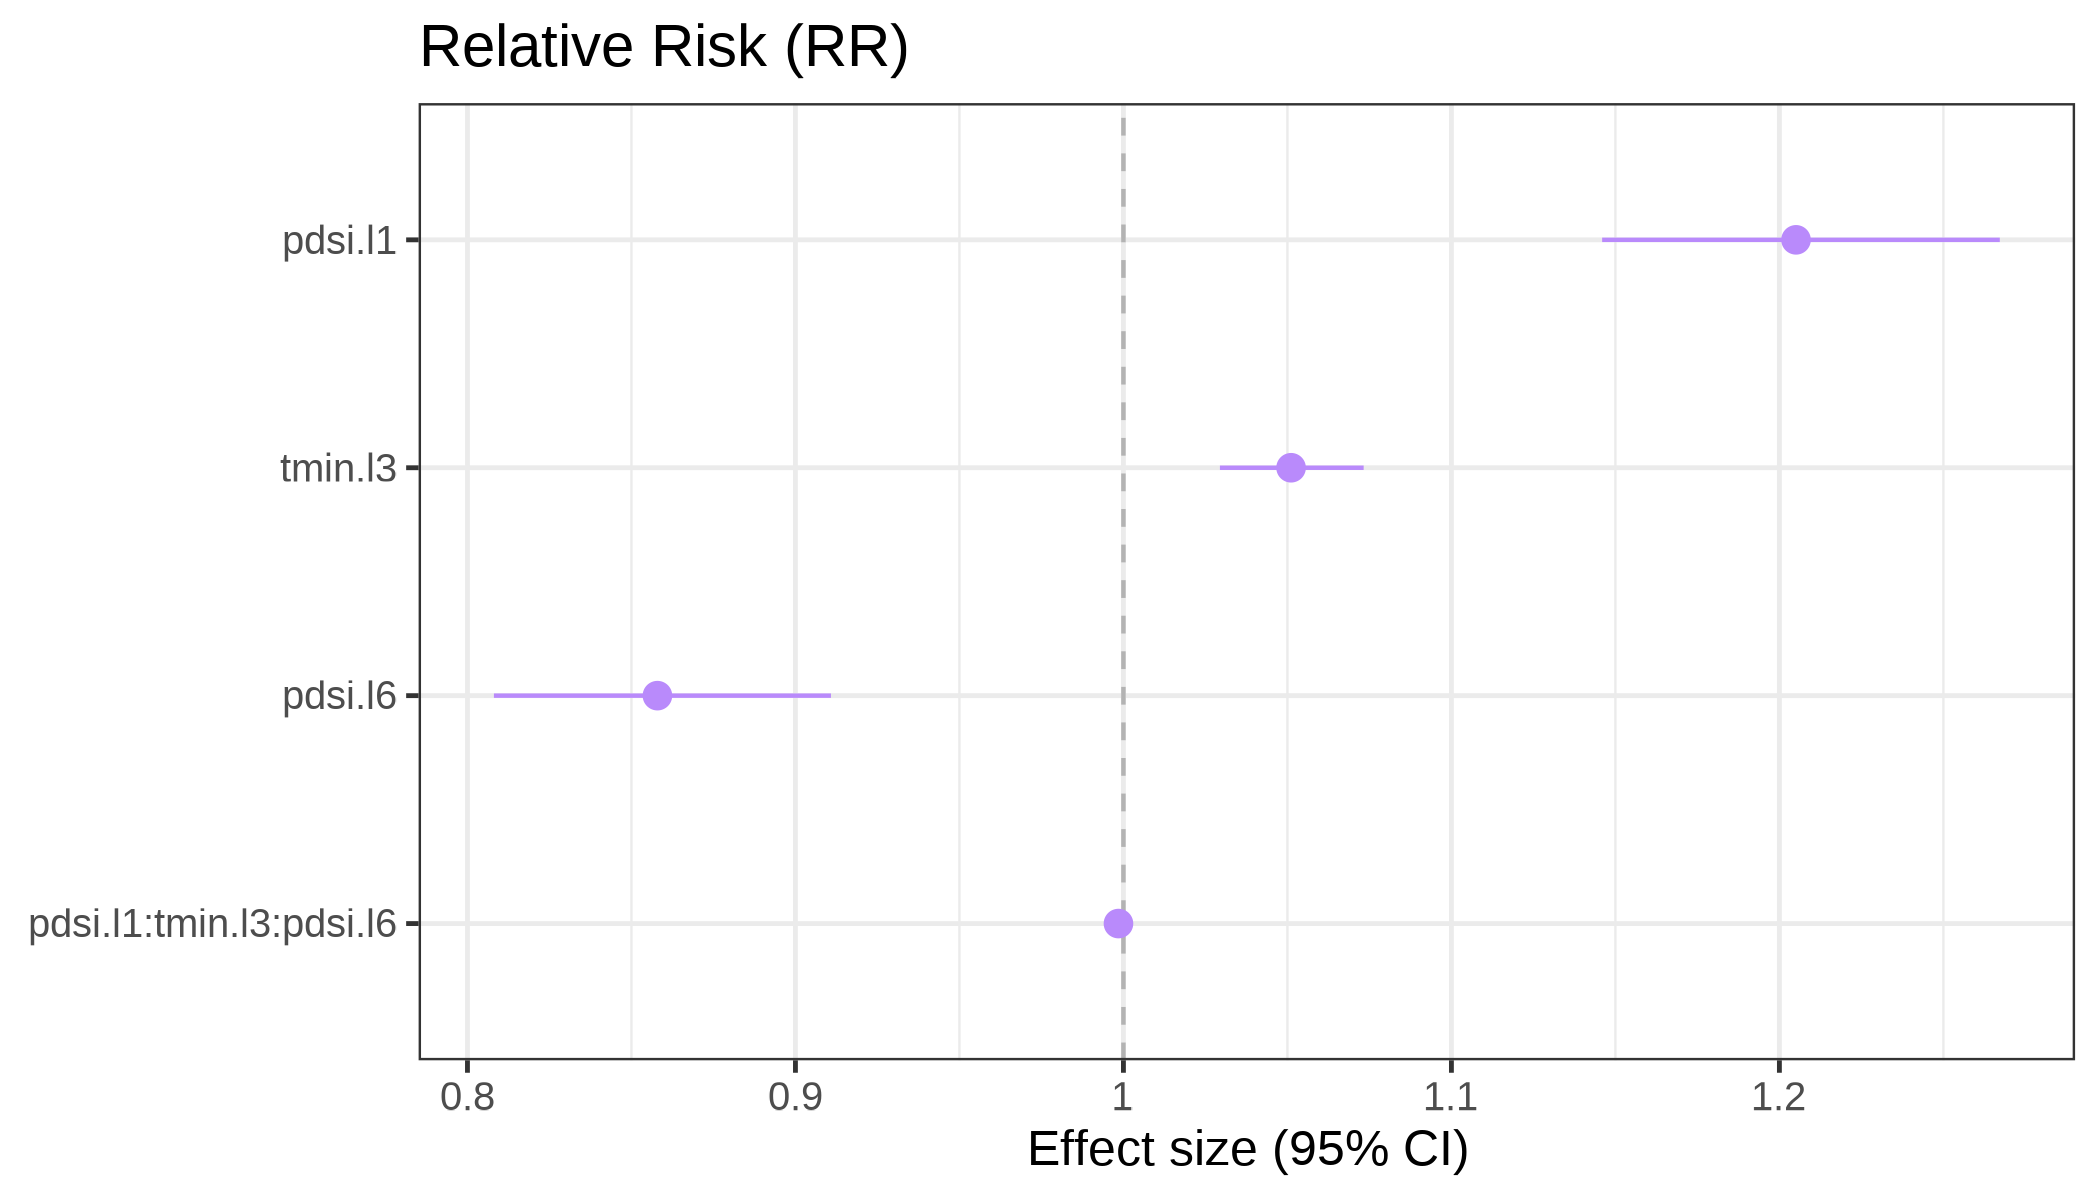
For model evaluation, GHRmodel provides a range of
functions for model diagnostics, interpretation and evaluation.
Functions with the prefix plot_* return graphical
ggplot2 or cowplot objects, allowing users to
easily customize visual outputs.
plot_coef_lin(
  model = results,
  exp = TRUE,
  title = "Relative Risk (RR)"
)
Giovenale
Moirano, PhD

Barcelona Supercomputing Center
Global Health Resilience
Carles Milà,
PhD
Barcelona Supercomputing Center
Global Health Resilience
Anna B.
Kawiecki, PhD
Barcelona Supercomputing Center
Global Health Resilience
Rachel Lowe,
PhD
Barcelona Supercomputing Center
Global Health Resilience (Group leader)